3.2 Throughput and latency
Our rules for numbers
- Each number has a date and a source.
- We do not mix live numbers and numbers from a model.
- We remove artifacts that increase or decrease a number. We tell what we removed.
- We give latency as p50 and p99. Half of the orders are faster than p50. One order in 100 is slower than p99.
Throughput
On 1 Nov 2026, a load test ran on an earlier chain without policing:
| Item | Value |
|---|---|
| Rate | 1,035 commands each second, for 120 s |
| Commands executed with proof | 145,235 of 145,235 |
| LATE orders, full tables, relay overflows | 0 |
| Credits rejections, sent again by the clients | 2,105 |
We did not do a load test on the policing chain.
Latency on the last chain (13 to 20 Nov 2026)
| Leg | p50 | p99 |
|---|---|---|
| CANON to executed | 135.51 ms | 256.81 ms |
| Executed to batch close | 4.62 ms | 20.69 ms |
| Batch close to FINAL | 72.27 ms | 133.31 ms |
| Full path (calculated, with the wait for the watermark) | approximately 226 ms |
This latency is too high, and we know the cause. On 3 Nov 2026, before policing, the full path was 22.5 ms at p50. On 6 Nov 2026, the stake rules started. With these rules, the host does not execute a batch before the previous batch has its certificate. Because of this, the batches do not overlap. Each batch waits for the FINAL of the previous batch (72 ms), and then for two evidence steps in the host (21 ms).
The data of all 9,053 minutes agrees:
| Item, median of all minutes | Value |
|---|---|
| Time between two batches | 104.2 ms |
| Batch close to FINAL | 72.4 ms |
| Host evidence steps for each batch | 21.3 ms |
| Stake preparation for each batch | 2.6 ms |
| CANON to executed (time that an order waits for its batch) | 134.5 ms |
Because of this, an order waits 134.5 ms for its batch. This wait is most of the 226 ms. The problem is in the host, not in the card.
What we will do. We will change the stake rules in the host. A batch will use the certificate of an older batch, not of the previous batch. Then the batches overlap again, as on 3 Nov 2026. We expect the full path to go back to approximately 22.5 ms, the value before the stake rules.
This change also changes the time when a stake penalty starts. It must have a complete design before we build it. We did not start the design.
Earlier measurements
| Date | Setup | Full path, p50 / p99 |
|---|---|---|
| 28 Oct 2026 | One order in each batch, 3 ms watermark | 10.4 / 14.8 ms |
| 3 Nov 2026 | Batches in parallel, 10 ms watermark, no policing | 22.5 / 38.1 ms |
| 13 to 20 Nov 2026 | Policing | approximately 226 ms / not measured |
Less than 1 ms: the design budget
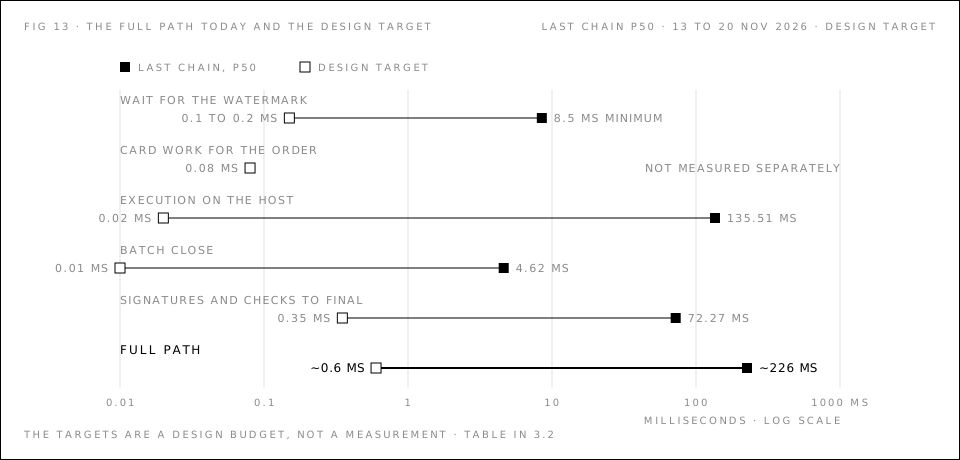
The design target for the full path is less than 1 ms from the wire stamp to FINAL. The testnet does not meet it today. The table shows where the time goes now, and the design target for each part.
| Part of the path | Last chain, p50 | Design target | What must change |
|---|---|---|---|
| Wait for the watermark | 8.5 ms minimum | 0.1 to 0.2 ms | Synchronized clocks. Then the wait must cover only the fiber and one peer stamp. |
| Card work for the order | not measured separately | 0.08 ms | Nothing. A model of the card logic gives this value. |
| Execution on the host | 135.51 ms | 0.02 ms | A batch must not wait for the certificate of the previous batch. The match itself is a few microseconds. |
| Batch close | 4.62 ms | 0.01 ms | Close a batch without a fixed wait |
| Signatures and checks to FINAL | 72.27 ms | 0.35 ms | FPGA cards at all sites sign in hardware. The card checks a signature in 0.154 ms (measured). |
| Full path | approximately 226 ms | approximately 0.6 ms |
The targets are a design budget, not a measurement. The only measurement today is a silicon test of 30 Sep 2026. In it, the card went from an accepted order to FINAL in 0.33 ms, with four peer signature checks. That test did not contain the match or the network. We will publish the full path when we measure it.
An artifact that we removed
On the policing chains, one metric compared the clock of the card with the clock of the host. It did not correct the offset between them. It showed approximately 21 s that was not real delay. We do not use that metric.
All latency on this page comes from inside the systems of the operator. It does not contain the network path of an outside client.